
USD/JPY H1 TF Analysis
Intro
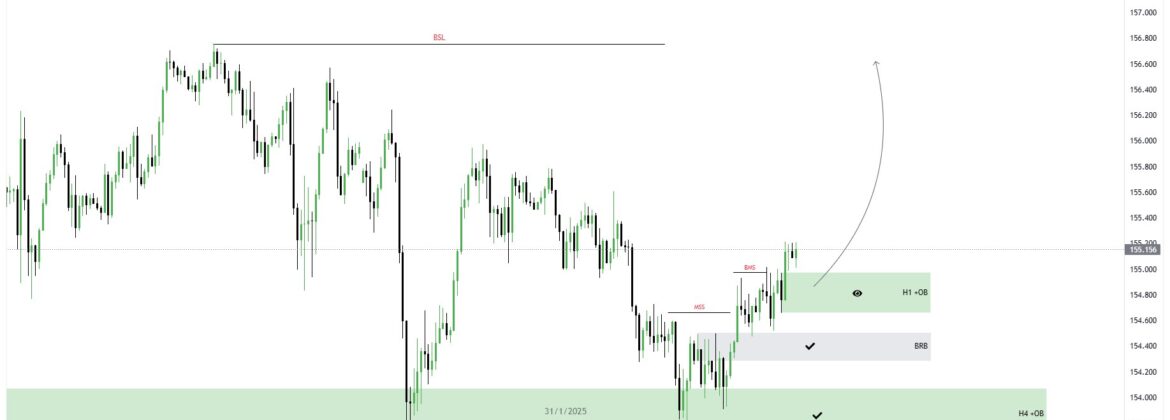
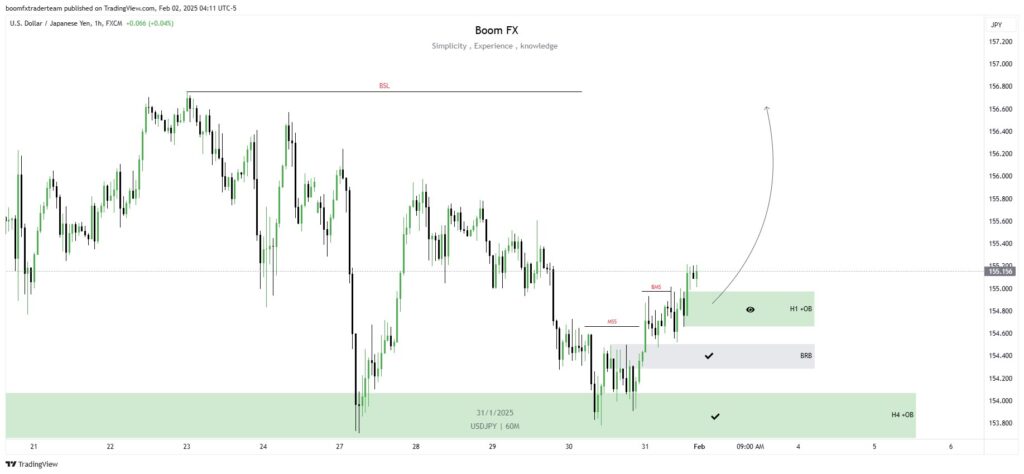
This analysis is based on identifying potential market structure shifts (MSS), break of market structure (BMS), and the presence of order blocks (OB) on the USD/JPY chart. The chart highlights areas of interest for possible bullish continuation after a retracement to identified demand zones.
Key Elements in the Chart
- Market Structure Shifts (MSS):
- A shift in market structure is noted, indicating a potential change in trend.
- Break of Market Structure (BMS):
- A BMS signifies a bullish reversal, supporting the idea of price potentially moving upward from current levels.
- Order Blocks (H1 and H4):
- H1 OB: A smaller order block closer to the current price, acting as a refined zone for a possible entry.
- H4 OB: A broader order block at a lower level, representing a strong demand zone where price might find significant support.
- Bullish Reaction Blocks (BRB):
- A smaller demand zone identified between the H1 and H4 order blocks, providing additional confluence for a potential bounce.
- Liquidity Levels (BSL):
- Buy-side liquidity above key highs is highlighted, suggesting a target area for price action.
- Bullish Continuation Bias:
- The upward arrow indicates a forecast of price rallying toward higher levels after interacting with the highlighted zones.
Trade Setup Idea
Bullish Setup:
- Entry Points:
- Look for bullish price action confirmation in the H1 OB or H4 OB zones before entering a buy position.
- Stop Loss:
- Place the stop loss below the H4 OB or a recent swing low for protection against downside risk.
- Take Profit:
- Target the liquidity level at BSL or higher levels around 155.600-156.000, as indicated by the forecasted arrow.
- Risk-Reward Ratio:
- Ensure a minimum of 1:3 risk-reward ratio to align with proper trade management.
Key Notes:
- Wait for confirmation (e.g., bullish engulfing candle, break of a lower timeframe structure) in the demand zones.
- Be cautious of any news events that may introduce volatility.
- Ensure proper trade management by adjusting stops to breakeven after price moves favorably.
This analysis suggests a bullish bias for USD/JPY, focusing on a well-defined plan to capitalize on potential upward momentum.
Leave A Comment