
US100 H4 TF Analysis

Introduction:
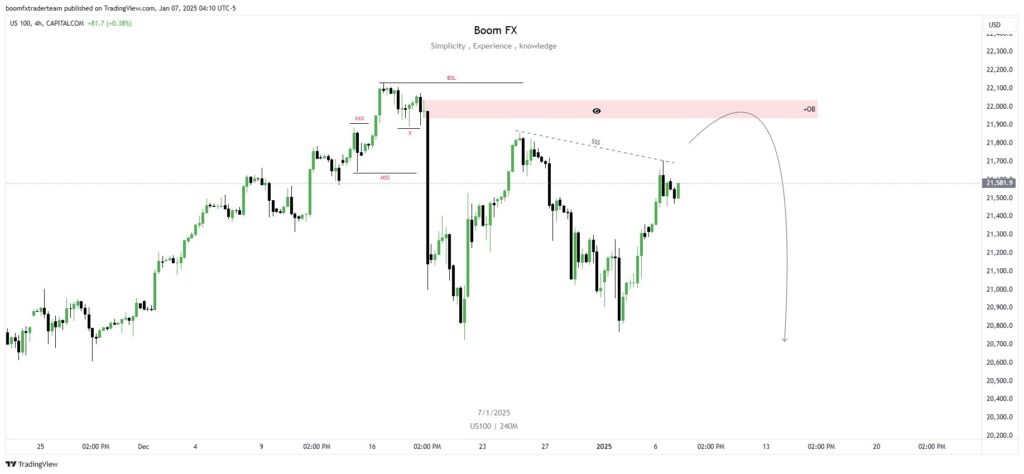
The analysis focuses on the US100’s price action, utilizing concepts like liquidity zones, market structure shifts (MSS), and supply/demand areas. The chart integrates a systematic approach with key highlights such as:
- Break of Structure (BSL): Highlighting liquidity above previous highs.
- Market Structure Shift (MSS): Indicating a reversal or significant directional change.
- Order Block (OB): A supply zone likely to act as resistance, where price could reverse after reaching it.
Description:
- Supply Zone (Red Box):
- Price is approaching a significant supply zone, marked in red. This area represents a previous order block (OB) and is a high-probability reversal zone.
- Traders often anticipate selling pressure in such zones, especially when aligned with liquidity grabs above key highs.
- Liquidity Grab Above BSL:
- The chart suggests a liquidity sweep above the Buy Side Liquidity (BSL), where weak stops are taken out before a reversal.
- Price has entered the supply zone and is showing signs of exhaustion, with a potential bearish rejection forming.
- Trendline Liquidity (SSS):
- A descending trendline (SSS) within the recent price action shows stacked liquidity.
- If this liquidity is tapped, price could further confirm a reversal.
- Expected Reversal Path:
- The arrow indicates a likely scenario where price rejects from the supply zone, breaking back below critical support levels and potentially targeting the Sell Side Liquidity (SSL) or new lows.
Trade Setup Idea:
Entry:
- Wait for bearish confirmation (e.g., rejection candlestick patterns like engulfing or pin bars) within the red supply zone.
Stop Loss:
- Place the stop loss just above the supply zone (beyond recent highs) to account for liquidity spikes.
Target:
- First target: Previous structural low near 21,000 (Sell Side Liquidity).
- Extended target: Further downside continuation toward 20,700 or lower.
Risk Management:
- Use appropriate risk-reward ratios (e.g., 1:3 or 1:4), and ensure position sizing aligns with your risk tolerance.
Alternative Scenario:
- If price breaks above the supply zone with strong bullish momentum, the setup becomes invalid. Watch for a potential breakout and retest for a bullish continuation.
Conclusion:
This analysis provides a high-probability bearish setup based on the H4 US100 chart. Patience and confirmation are crucial for execution. Always combine this technical insight with broader market context and risk management principles.
Leave A Comment