Forecast

Deaching of the great explorer of the truth the builder
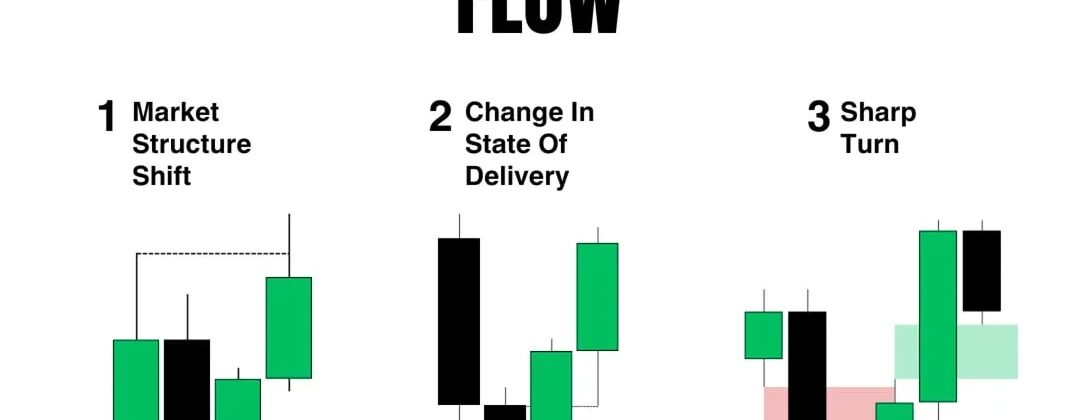
Understanding Price Shifting Order Flow – 3 Key Methods Introduction One of the most critical aspects of trading is identifying when price action shifts direction, signaling a potential trade opportunity. The image above highlights three popular methods used to detect such shifts in order flow: 1️⃣ Market Structure Shift (MSS)2️⃣ Change in State of Delivery […]
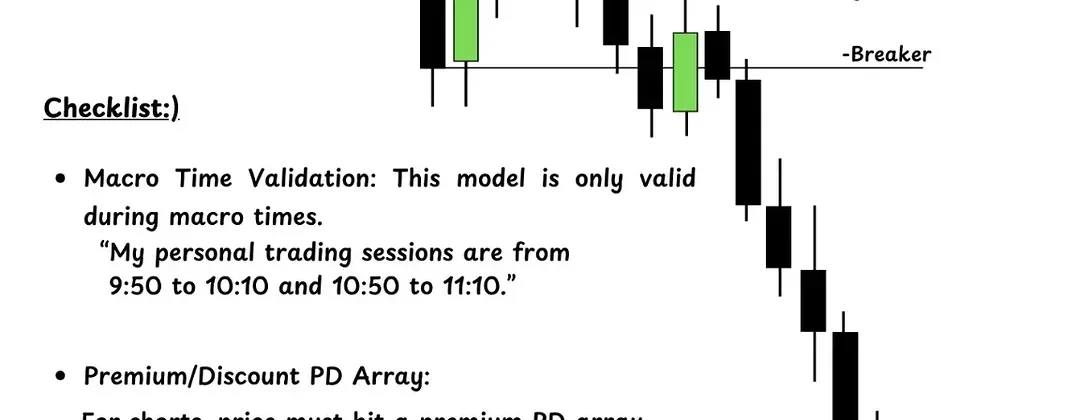
Macro Time-Based Model: An Introduction & Trade Setup Guide Introduction The Macro Time-Based Model is a structured approach to trading, primarily recommended for NQ (Nasdaq) and ES (E-mini S&P 500) futures. This model focuses on specific macro time windows and utilizes key price action concepts to determine high-probability trade setups. The model incorporates elements such […]
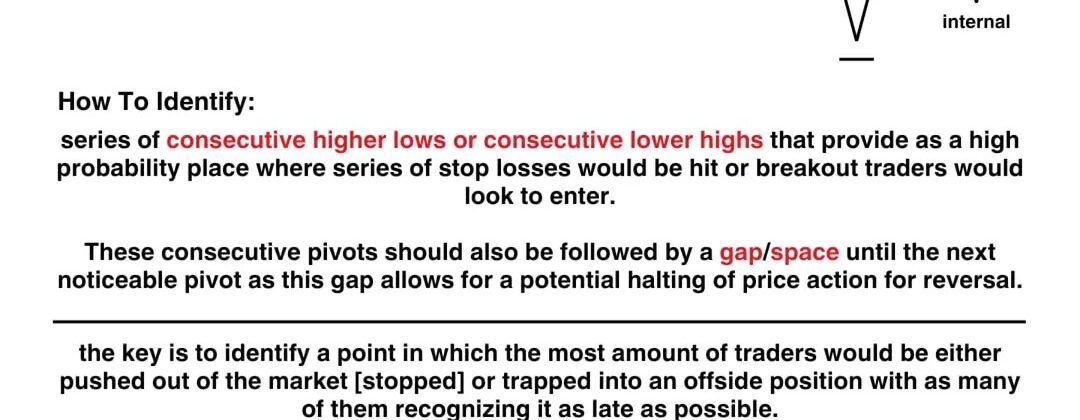
Internal Liquidity: Understanding & Trade Setup Introduction Internal liquidity refers to areas within a market structure where stop losses and liquidity pools accumulate due to consecutive price movements. These areas serve as points where traders’ positions get trapped, leading to potential liquidity grabs and price reversals. Understanding internal liquidity helps traders anticipate where price may […]
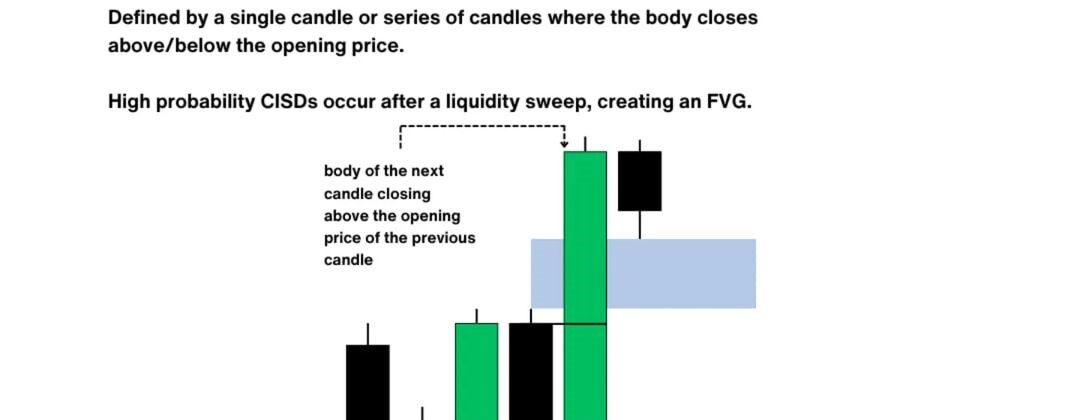
Introduction to Change in State of Delivery (CISD) The Change in State of Delivery (CISD) is a concept in price action trading that indicates a potential shift in market structure. It typically occurs after a liquidity sweep, where price hunts for liquidity (stop-loss orders) before reversing direction. The CISD is identified when the body of […]
Ignoring Higher Time Frame (HTF) Analysis in Trading Introduction One of the most common mistakes traders make is ignoring higher time frame (HTF) analysis. Lower time frames (LTF), such as the 15-minute (M15) chart, can show bullish or bearish setups that may appear valid. However, these setups often fail if they go against the overall […]

Introduction to ICT Daily Bias & 3 Candle Pattern (CISD) The ICT Daily Bias framework uses price action patterns to determine market direction, particularly through the “3 Candle Pattern” (CISD). This method is commonly employed by traders following Inner Circle Trader (ICT) concepts to analyze the daily price trend and bias. The 3 Candle Pattern […]

Candle Range Theory (CRT) focuses on identifying trading opportunities based on the behavior and patterns of candlesticks. It uses the price range and specific formations to determine potential breakouts or reversals. Two key setups illustrated in CRT are: Break Setup Turtle Soup Setup Trade Setup Tips: 0 0

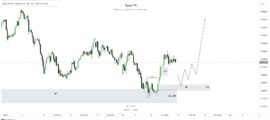
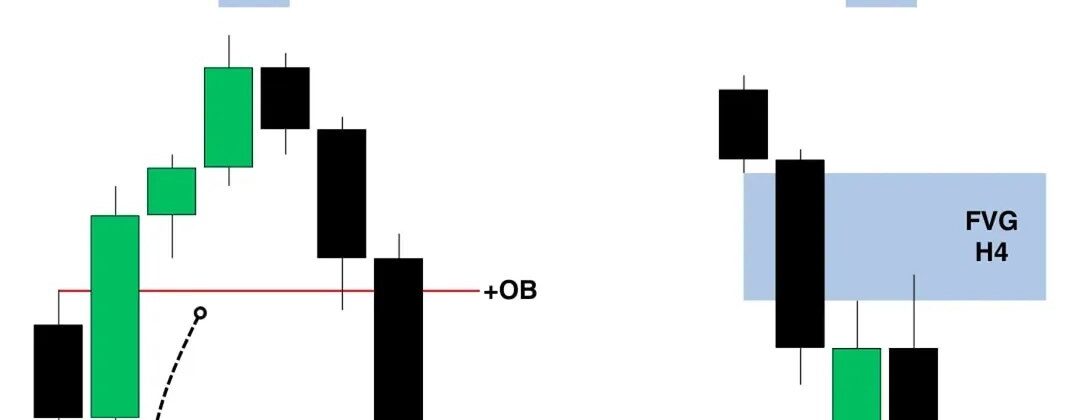
Introduction This scenario represents a structured method for identifying and capitalizing on bullish opportunities in the market. It leverages higher-timeframe Points of Interest (POIs) such as Fair Value Gaps (FVGs), Order Blocks (OBs), or Breaker Blocks (BBs) and incorporates Smart Money Techniques (SMT) divergence to confirm the trade direction. Timeframes considered are H1/M15, ensuring alignment […]

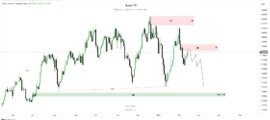
Key Concepts in Breaker POI: Order Block (OB): Represents a key price area where large institutional orders were placed. Price often reacts to these levels, either reversing or continuing. Shift: A change in market structure where price breaks the prior trend or key level, indicating a potential reversal. Breaker: A former order block that gets […]
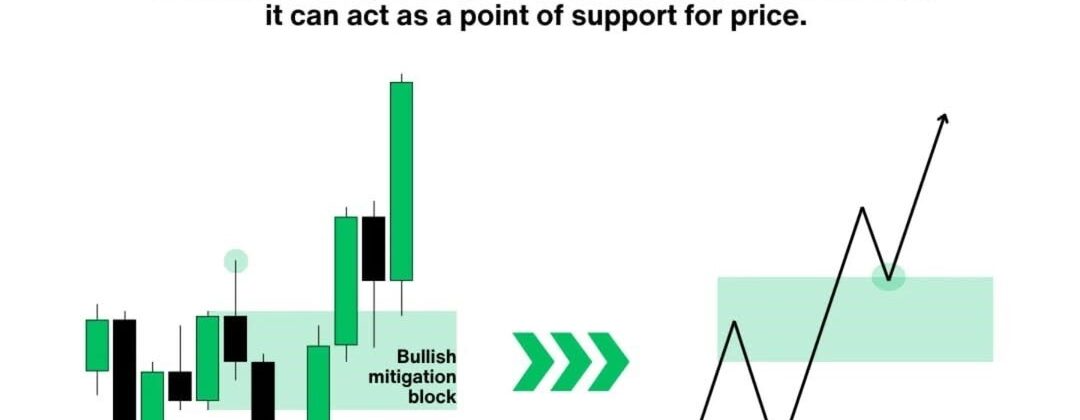
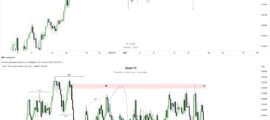
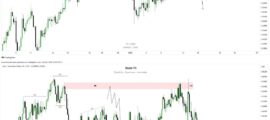
Introduction to Bullish Mitigation Block A Bullish Mitigation Block forms when price action creates a low, a high, and then a higher low. The area around the high between the low and the higher low becomes the mitigation block, a zone of interest where price may revisit later and act as support for further bullish […]