Forecast

Deaching of the great explorer of the truth the builder

Chart Overview Trade Setup Idea Introduction: This trade setup assumes that EUR/NZD might experience a rejection from the marked OB area, leading to a bearish move. Plan: Risk Management: Scenario Validation: 1 0

Introduction: The analysis focuses on the US100’s price action, utilizing concepts like liquidity zones, market structure shifts (MSS), and supply/demand areas. The chart integrates a systematic approach with key highlights such as: Description: Trade Setup Idea: Entry: Stop Loss: Target: Risk Management: Alternative Scenario: Conclusion: This analysis provides a high-probability bearish setup based on the […]

Key Observations: Potential Trade Setups: Bullish Setup: Risk Management and Tips: Alternative Scenario: 2 0

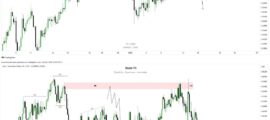
Key Observations: Potential Trade Setups: Bullish Scenario: Alternative Setup: Key Considerations: 2 0

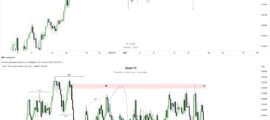
Key Elements Observed on the Chart: Potential Trade Setup: Bearish Scenario: Alternative Setup: Key Considerations: 2 0

USOIL Daily Analysis Overview: The daily chart for USOIL showcases a bearish trend structure with key levels identified for potential sell opportunities. Institutional concepts like Break of Structure (BMS), Order Blocks (OB), and liquidity points are central to the analysis. The projection anticipates a downward move after a retracement into supply zones. Key Observations: Trade […]
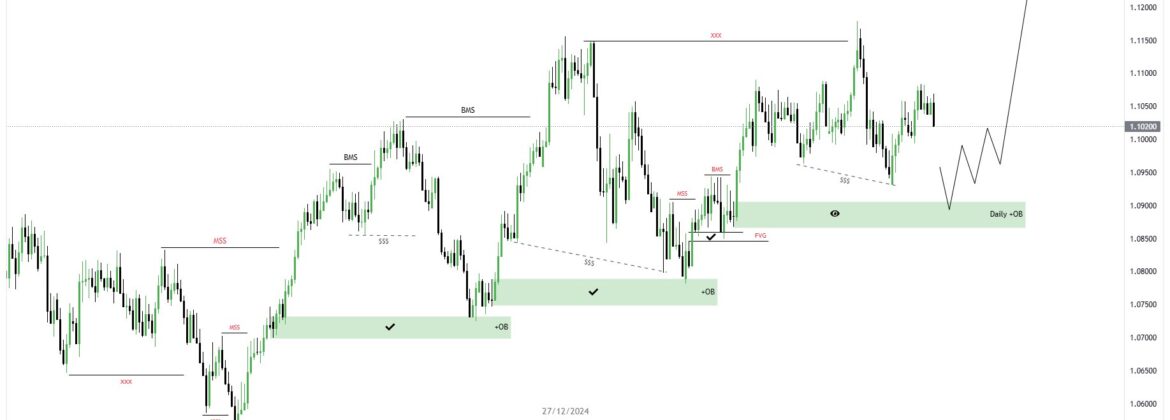
AUD/NZD Daily Analysis Overview: The daily chart for AUD/NZD highlights a clear structure of market behavior, with several key technical concepts like Break of Structure (BMS), Mitigation, and Fair Value Gaps (FVG). The focus appears to be on identifying potential reversal and continuation zones, aligning with a bullish outlook. Key Observations: Trade Setup Idea: Introductory […]
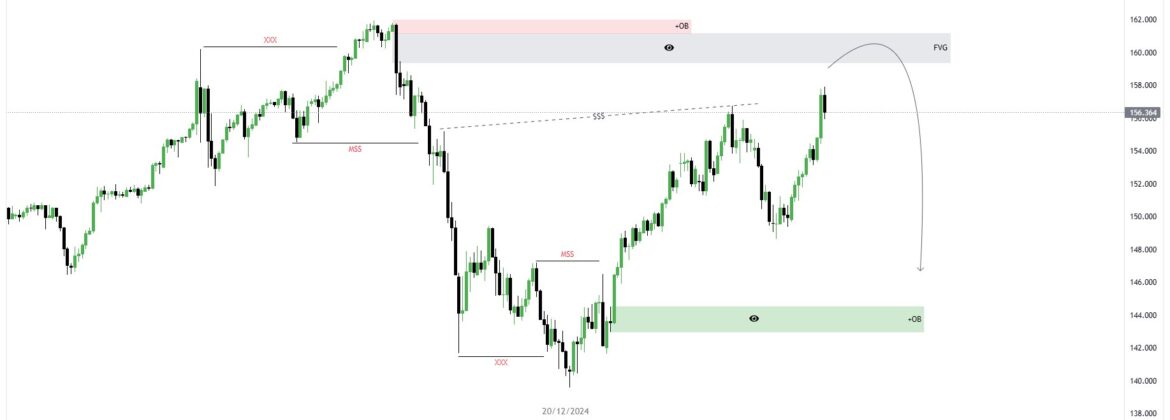
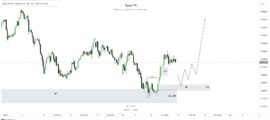
Boom FX Analysis – USD/JPY (Daily Chart) Date: December 22, 2024Key Principles: Simplicity, Experience, Knowledge Market Overview: The USD/JPY pair has shown a strong bullish rally recently, reaching a Fair Value Gap (FVG) and tapping into a daily supply zone (OB) around the 160.000 level. This area marks a significant resistance point, with indications of […]

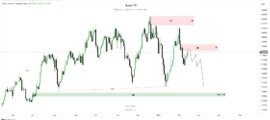
Boom FX Analysis – USD/CHF (Daily Chart) Date: December 22, 2024Key Principles: Simplicity, Experience, Knowledge Market Overview: The USD/CHF pair is currently displaying a significant bearish bias, following a strong upward correction. The price has tapped into a daily supply zone (highlighted in red), which aligns with a bearish order block (OB) near the 0.9150 […]
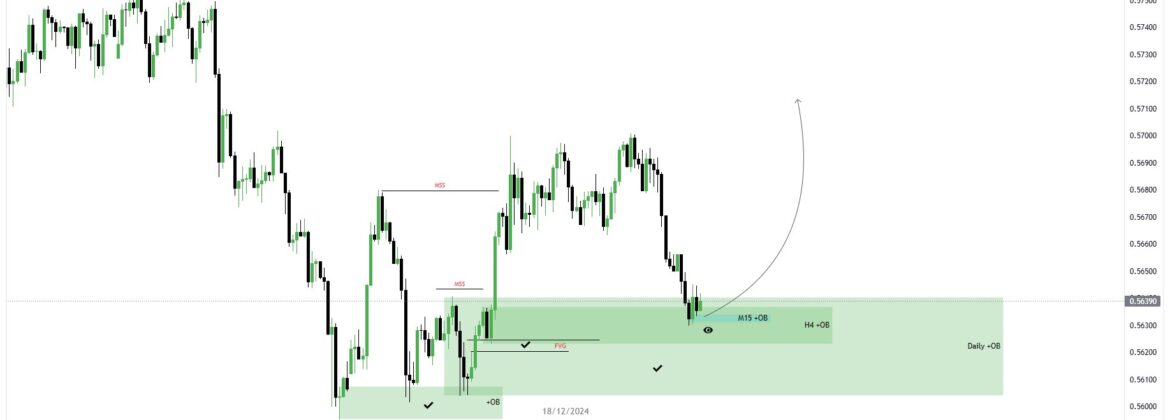
The chart showcases a clear bearish market structure, but opportunities arise for a bullish reversal based on price interaction with multiple demand zones. This analysis focuses on key structural elements: MSS (Market Structure Shift), OB (Order Blocks), and FVG (Fair Value Gaps), all of which are valuable in SMC (Smart Money Concepts). Key Observations Trade […]