Forecast

Deaching of the great explorer of the truth the builder
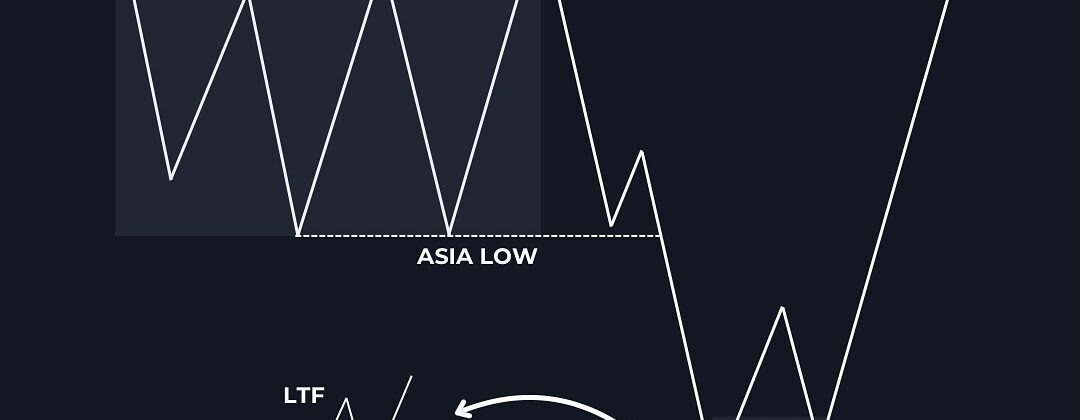
“Asia Sweep” The “Asia Sweep” is a concept used in trading that focuses on liquidity manipulation during or after the Asian trading session. The chart highlights how price tends to consolidate during the Asian session, creating well-defined Asia Highs and Asia Lows. After this consolidation, price typically sweeps one of these liquidity levels (either the […]
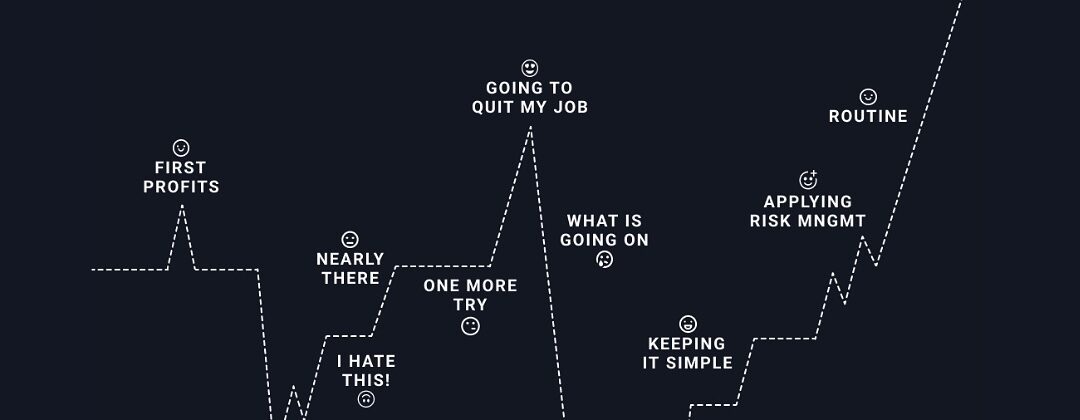
“The Traders Journey”: This image visually represents the emotional and psychological stages that traders commonly experience as they navigate the challenges of the trading world. The chart is shaped like a jagged line, symbolizing the highs and lows of a trader’s mindset and performance over time. Each labeled point corresponds to a distinct phase in […]

Introduction to the Breaker Entry Model The Breaker Entry Model is a price action-based trading strategy often used by traders focusing on smart money concepts. This strategy takes advantage of market manipulation where liquidity is swept (stop-losses or pending orders), followed by a reversal and structural confirmation. The “breaker” refers to a price zone that […]
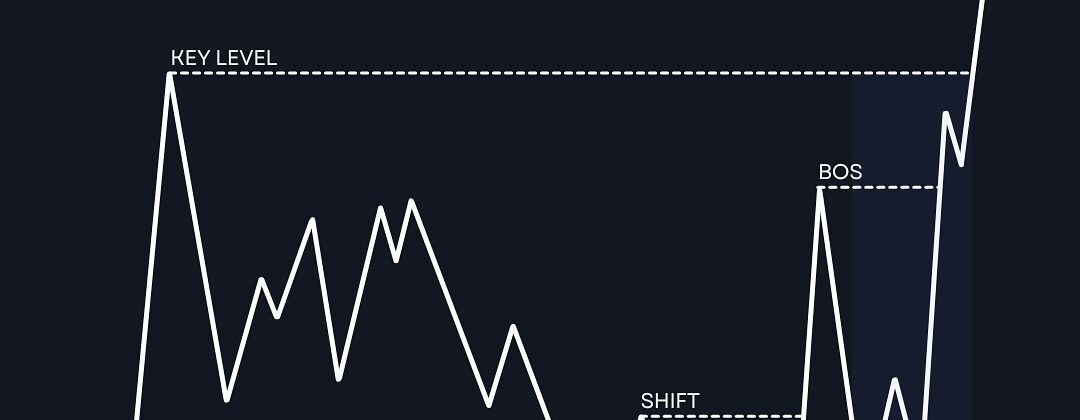
Introduction to Sweep Entry A “Sweep Entry” refers to a price action technique where the market temporarily breaches a significant level of liquidity (like support or resistance) before reversing in the intended direction. This occurs because institutional players often manipulate prices to collect liquidity before making larger moves. This concept leverages the understanding of liquidity […]
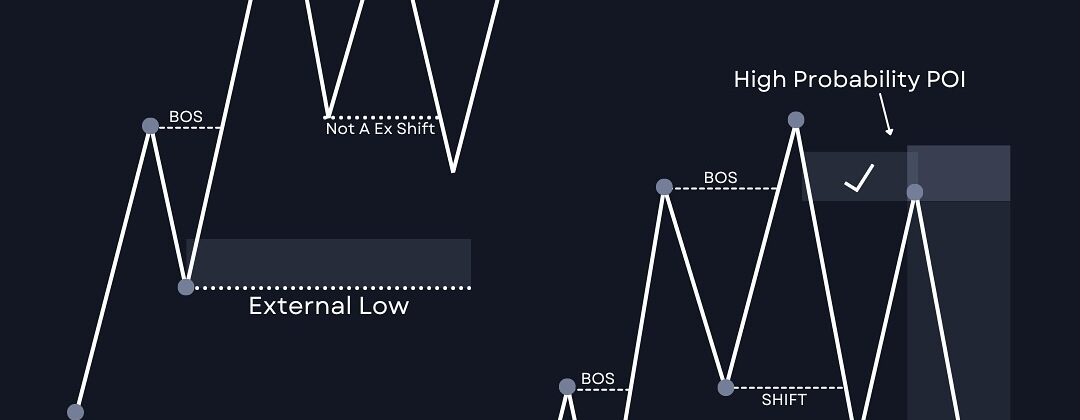
“No Shift = No Trade,” focusing on structural market shifts as prerequisites for trade setups. It highlights how external highs and lows, along with structural shifts, dictate high-probability versus low-probability trade opportunities. Key Elements: Trade Setup Ideas: Introduction: The principle “No Shift = No Trade” underscores the importance of structural validation in trading. By focusing […]
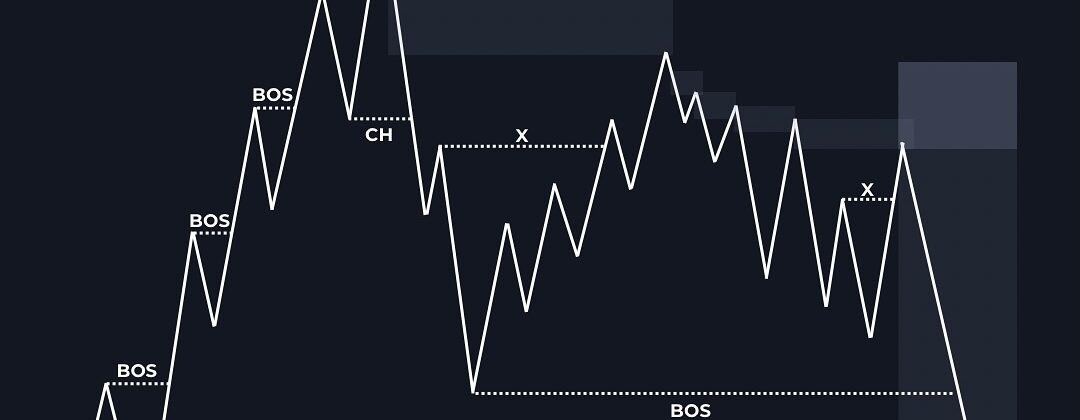
“Mapping Process,” likely for price action analysis in financial trading. Key terms such as BOS (Break of Structure), CH (Change), and “X” are marked, showcasing market structure shifts and potential reversal or continuation points. Breakdown: Trade Setup Ideas: Introduction: The mapping process simplifies price action by visually identifying structural changes and key areas of interest. […]

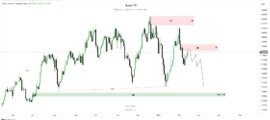
USOIL Daily Analysis Overview: The daily chart for USOIL showcases a bearish trend structure with key levels identified for potential sell opportunities. Institutional concepts like Break of Structure (BMS), Order Blocks (OB), and liquidity points are central to the analysis. The projection anticipates a downward move after a retracement into supply zones. Key Observations: Trade […]
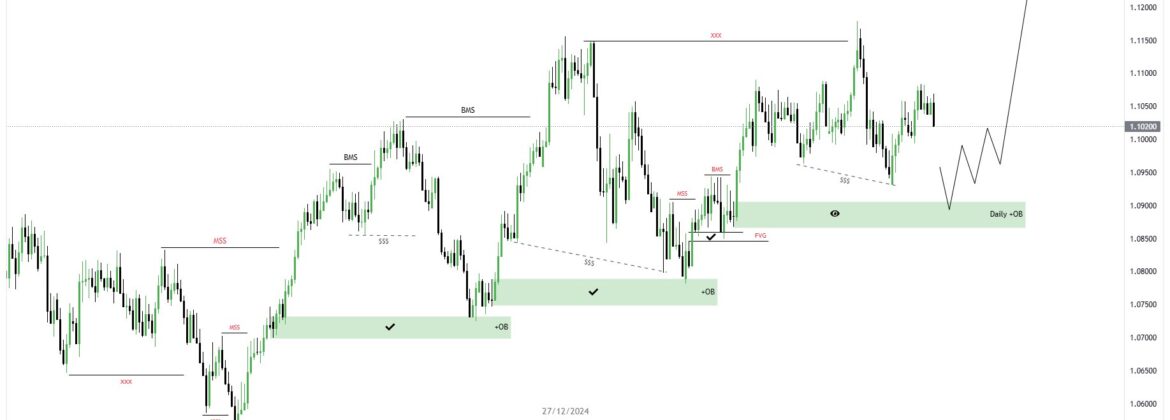
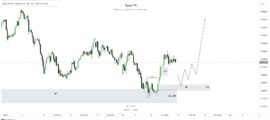
AUD/NZD Daily Analysis Overview: The daily chart for AUD/NZD highlights a clear structure of market behavior, with several key technical concepts like Break of Structure (BMS), Mitigation, and Fair Value Gaps (FVG). The focus appears to be on identifying potential reversal and continuation zones, aligning with a bullish outlook. Key Observations: Trade Setup Idea: Introductory […]
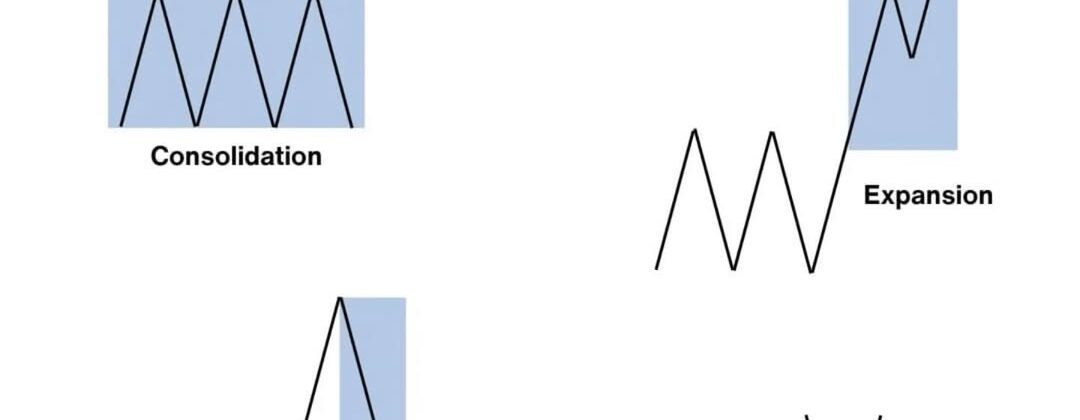
The 4 Key Elements in Trading Successful trading requires a solid understanding of market structure and price movement. The four key elements—Consolidation, Expansion, Retracement, and Reversal—help traders identify market conditions, set appropriate entries, and manage risks effectively. Let’s explore each element and discuss potential trade setups. 1. Consolidation Description: Trade Setup Idea: 2. Expansion Description: […]
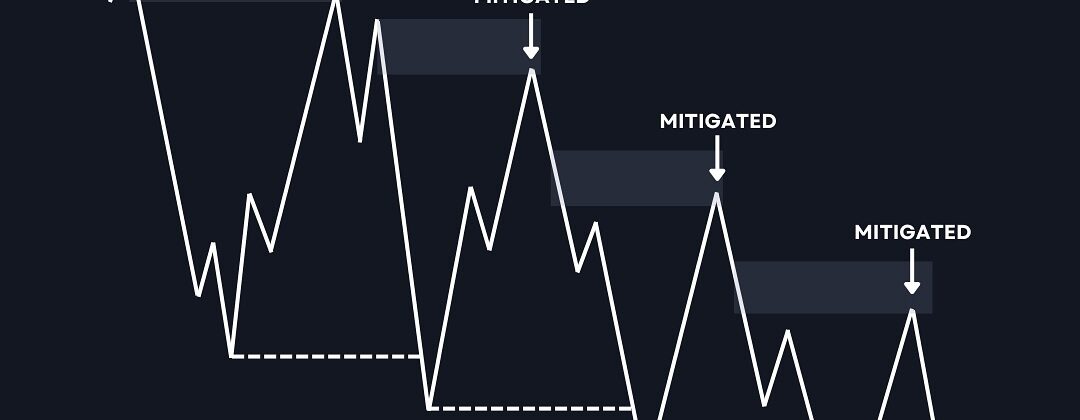
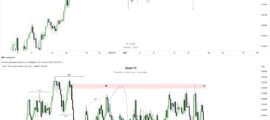
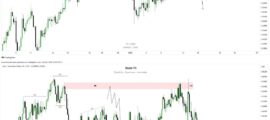
What is Mitigation? Mitigation refers to the market revisiting or retesting previously unbalanced price levels (such as order blocks, fair value gaps, or supply/demand zones) to absorb liquidity and fulfill institutional orders. It’s a key concept in price action analysis and Smart Money trading strategies. Key Observations in the Image: Trade Setup Ideas: Intro for […]