Forecast

Deaching of the great explorer of the truth the builder

Chart Analysis Potential Trade Setup Introductory Summary This H4 timeframe analysis highlights a structured approach to trading the NAS100 using supply and demand zones, liquidity sweeps, and market structure shifts. By aligning with key technical levels, traders can formulate precise entry and exit strategies while adhering to proper risk management principles. 0 0

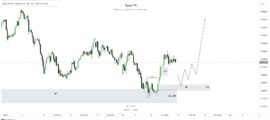
Introduction This scenario represents a structured method for identifying and capitalizing on bullish opportunities in the market. It leverages higher-timeframe Points of Interest (POIs) such as Fair Value Gaps (FVGs), Order Blocks (OBs), or Breaker Blocks (BBs) and incorporates Smart Money Techniques (SMT) divergence to confirm the trade direction. Timeframes considered are H1/M15, ensuring alignment […]

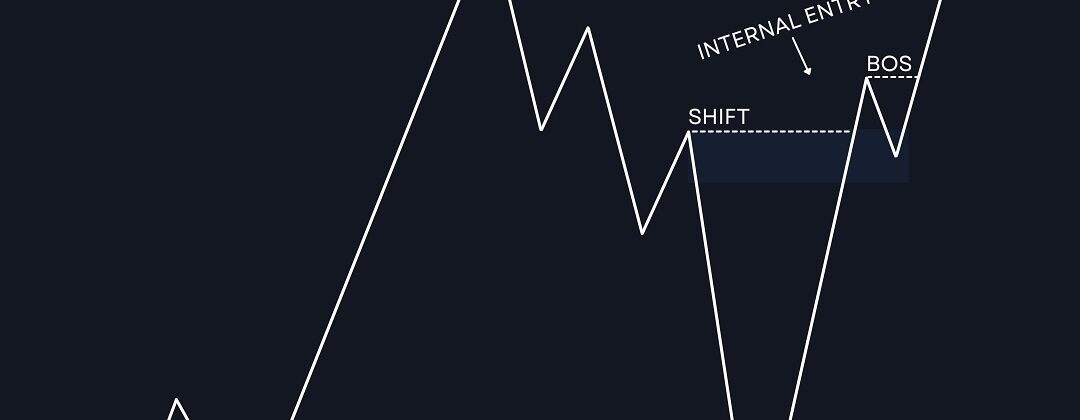
Key Concepts in Breaker POI: Order Block (OB): Represents a key price area where large institutional orders were placed. Price often reacts to these levels, either reversing or continuing. Shift: A change in market structure where price breaks the prior trend or key level, indicating a potential reversal. Breaker: A former order block that gets […]

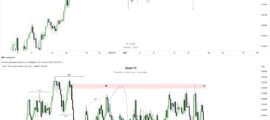
Introduction The GBP/JPY pair is undergoing a significant corrective move after a strong bearish impulse. Key zones such as the Fair Value Gap (FVG), Breaker Block (BRB), and Order Blocks (+OB) are mapped out, providing clues for potential reversals or continuation moves. The chart also identifies liquidity levels (“$$$”) and market structure shifts (MSS), which […]

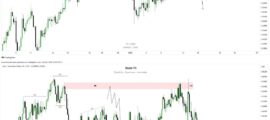
Introduction The EUR/GBP pair is currently in a corrective phase within a broader bullish structure. The chart highlights a key area of interest, marked as “FVG” (Fair Value Gap), where a potential retracement could occur before resuming the upward momentum. Key elements on the chart: Trade Setup Idea Additional Notes 0 0
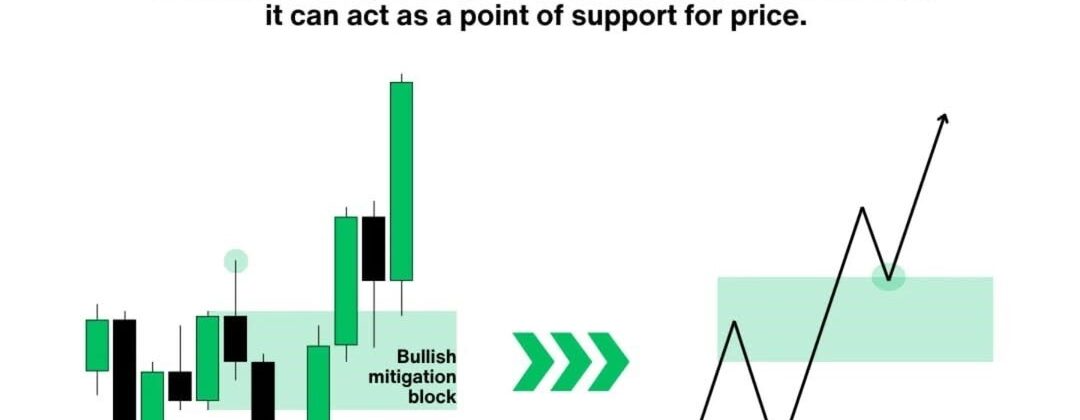
Introduction to Bullish Mitigation Block A Bullish Mitigation Block forms when price action creates a low, a high, and then a higher low. The area around the high between the low and the higher low becomes the mitigation block, a zone of interest where price may revisit later and act as support for further bullish […]
Introduction The market moves in waves, creating highs and lows. The terms internal and external liquidity refer to areas where the market attracts participants: The goal is to enter trades as the price shifts from internal to external liquidity, aligning with a trend or reversal strategy. Key Concepts in the Chart Trade Setup Ideas Tips […]
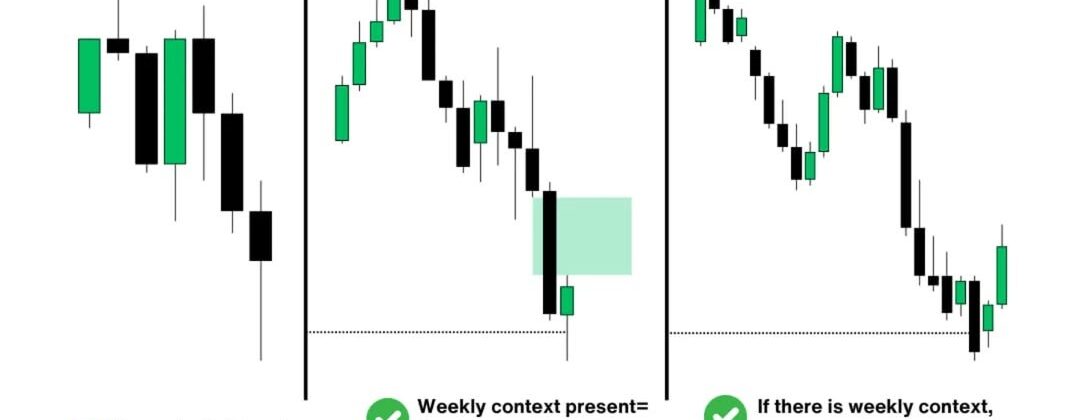
Introduction to Higher Timeframe Analysis When trading, analyzing the Monthly, Weekly, and Daily timeframes provides a broader market perspective and helps identify major trends, key levels, and context. These higher timeframes allow traders to filter out low-probability movements that might occur in smaller timeframes like 4H, 1H, or lower. By understanding the market’s context through […]

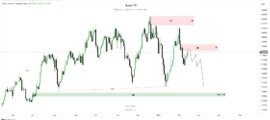
Chart Overview Trade Setup Idea Introduction: This trade setup assumes that EUR/NZD might experience a rejection from the marked OB area, leading to a bearish move. Plan: Risk Management: Scenario Validation: 1 0
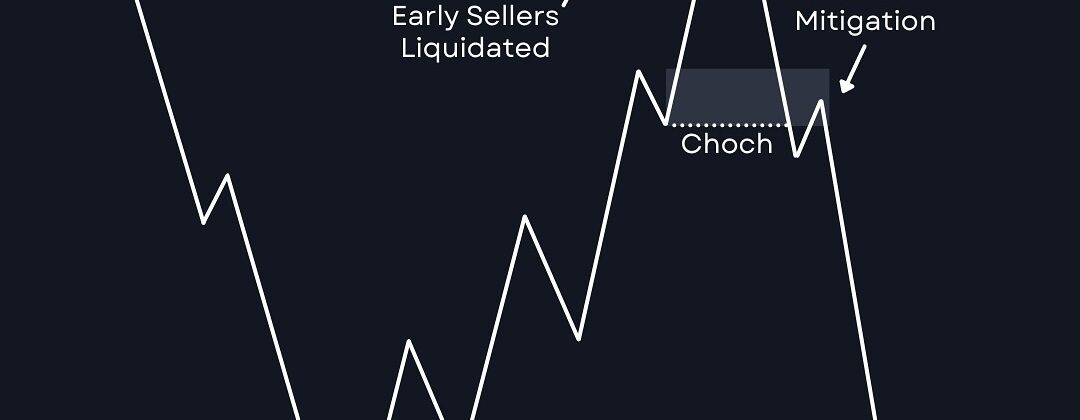
What is the Early Seller Trap? The Early Seller Trap is a market manipulation technique used to liquidate premature or aggressive sell entries. It targets retail traders who enter early into sell positions without waiting for proper confirmation. By sweeping liquidity above resistance levels or highs, smart money traps sellers before reversing price direction. Key […]