Forecast

Deaching of the great explorer of the truth the builder
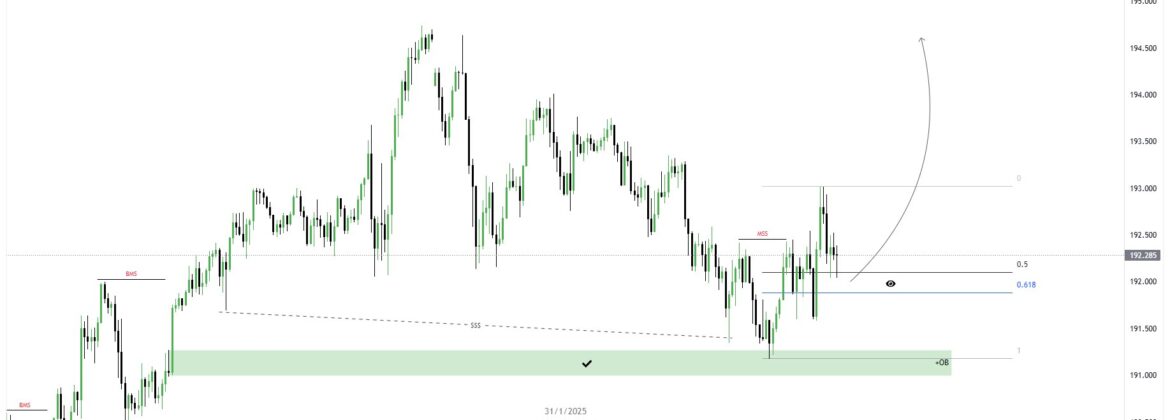
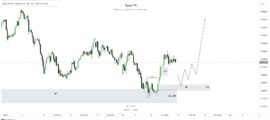
GBPJPY H1 Forecast & Trade Setup Introduction This is a 1-hour (H1) chart of GBP/JPY, showing a technical setup based on market structure, liquidity, and Fibonacci levels. The chart suggests a potential bullish move after a liquidity grab and mitigation of an order block (OB) zone. Key Observations Trade Setup Idea Long (Buy) Setup Final […]
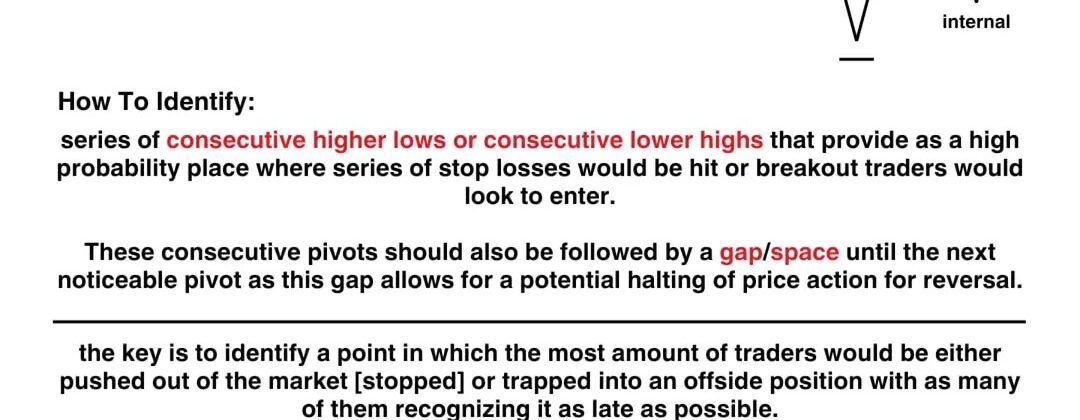
Internal Liquidity: Understanding & Trade Setup Introduction Internal liquidity refers to areas within a market structure where stop losses and liquidity pools accumulate due to consecutive price movements. These areas serve as points where traders’ positions get trapped, leading to potential liquidity grabs and price reversals. Understanding internal liquidity helps traders anticipate where price may […]
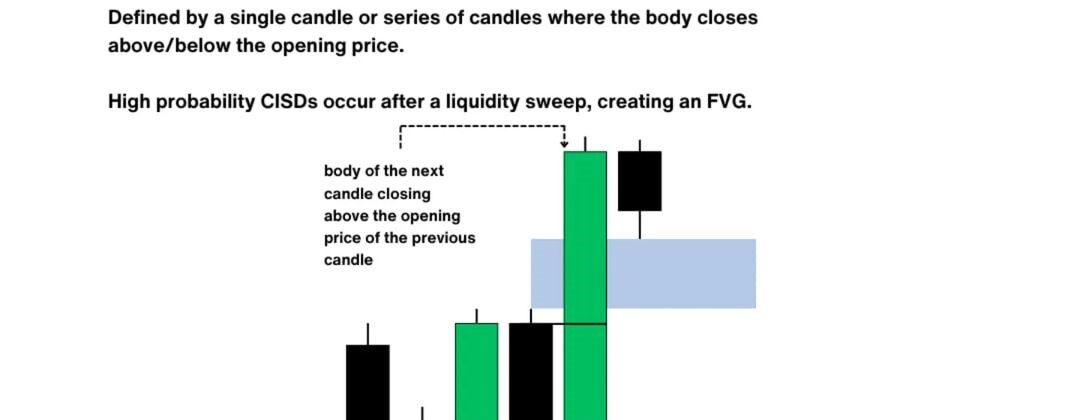
Introduction to Change in State of Delivery (CISD) The Change in State of Delivery (CISD) is a concept in price action trading that indicates a potential shift in market structure. It typically occurs after a liquidity sweep, where price hunts for liquidity (stop-loss orders) before reversing direction. The CISD is identified when the body of […]
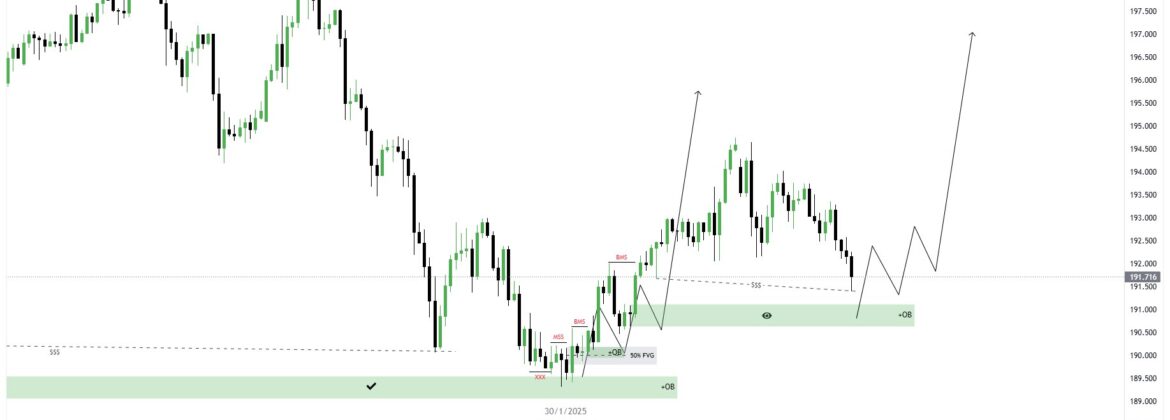
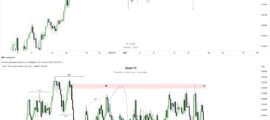
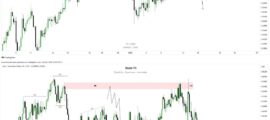
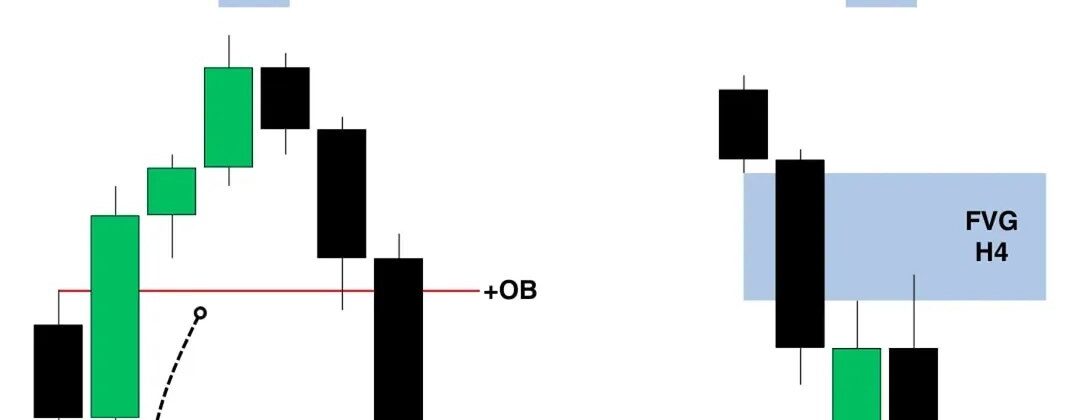
GBPJPY H4 Analysis & Trade Setup – 30th Jan 2025 Introduction The GBPJPY pair is currently in a bullish market structure after breaking a key resistance zone. The H4 chart shows a potential retracement into a demand zone before a continuation to the upside. The price is approaching a previously respected order block (OB) zone, […]

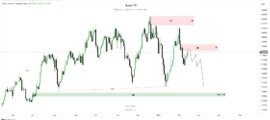
Introduction This chart setup exemplifies a clean application of supply zone trading principles in the Nasdaq 100 (US100). The analysis focuses on price reacting within a marked resistance (supply) zone, triggering a significant sell-off as expected. Trade Setup and Idea Conclusion This setup showcases the importance of combining technical tools like supply/demand zones and structure […]

NAS100 Trade Breakdown – Precision Execution 🎯 Introduction In this trade setup, we successfully predicted the movement of NAS100 with a high-probability short trade. By identifying key levels such as Order Blocks (OBs) and liquidity zones, we executed a sell position from a premium area and targeted a demand zone. This strategy showcases the importance […]
Ignoring Higher Time Frame (HTF) Analysis in Trading Introduction One of the most common mistakes traders make is ignoring higher time frame (HTF) analysis. Lower time frames (LTF), such as the 15-minute (M15) chart, can show bullish or bearish setups that may appear valid. However, these setups often fail if they go against the overall […]

Introduction to ICT Daily Bias & 3 Candle Pattern (CISD) The ICT Daily Bias framework uses price action patterns to determine market direction, particularly through the “3 Candle Pattern” (CISD). This method is commonly employed by traders following Inner Circle Trader (ICT) concepts to analyze the daily price trend and bias. The 3 Candle Pattern […]

Candle Range Theory (CRT) focuses on identifying trading opportunities based on the behavior and patterns of candlesticks. It uses the price range and specific formations to determine potential breakouts or reversals. Two key setups illustrated in CRT are: Break Setup Turtle Soup Setup Trade Setup Tips: 0 0

Chart Analysis Potential Trade Setup Introductory Summary This H4 analysis of EUR/JPY emphasizes structured trading opportunities by focusing on order blocks, fair value gaps, and market structure shifts. Traders can utilize these zones for precise entries and exits while managing risk effectively. The demand and supply zones, coupled with liquidity levels, provide a roadmap for […]