
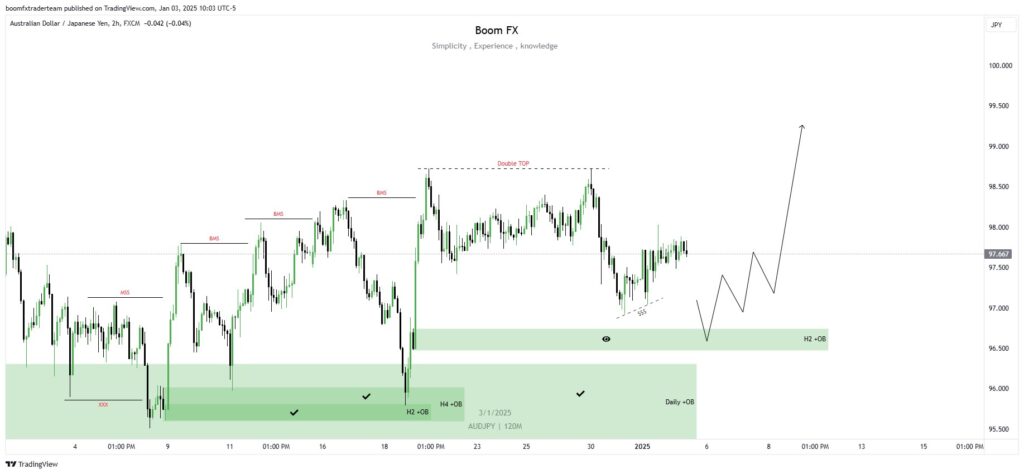
AUDJPY H2 TF Analysis

Key Observations:
- Market Structure Shifts (MSS) and Break of Structure (BMS):
- Multiple BMS levels indicate changes in market momentum, from bearish to bullish.
- The market seems to be in a bullish phase after a strong reaction from a demand zone.
- Order Blocks (OB):
- A clear H2 and H4 bullish order block (green zones) is marked, suggesting significant areas of demand where buyers have shown interest.
- Double Top:
- A double-top formation is identified near resistance, indicating potential liquidity above this level.
- Trendline Support:
- A bullish trendline is forming, providing additional confluence for potential upward continuation.
- Daily Order Block:
- A larger daily OB is highlighted as a zone of interest for a higher time frame perspective.
- Projected Movement:
- The anticipated price action shows retracements toward the OB zones, followed by bullish continuation to higher levels.
Potential Trade Setups:
Bullish Scenario:
- Entry:
- Wait for price to retrace into the marked H2 or H4 bullish OB zone (around 96.500–97.000).
- Look for bullish confirmation patterns, such as bullish engulfing candles, pin bars, or breakouts of minor highs on lower time frames (e.g., M15 or M30).
- Stop Loss:
- Place the stop loss below the OB zone (around 96.000) to account for potential stop hunts.
- Take Profit:
- Target the liquidity above the double top or higher resistance levels, such as 98.500 or beyond, for a favorable risk-to-reward ratio.
Alternative Setup:
- If price fails to hold the OB zones and breaks the trendline to the downside, reevaluate the bias and look for potential bearish setups targeting lower levels.
Key Considerations:
- Risk Management:
- Use appropriate position sizing and adhere to a solid risk-to-reward ratio.
- Lower Time Frame Refinement:
- Use lower time frames to refine entries and enhance precision.
- News and Events:
- Check for high-impact economic events related to AUD or JPY that might cause unexpected volatility.
Leave A Comment