
USOIL Daily Analysis

USOIL Daily Analysis
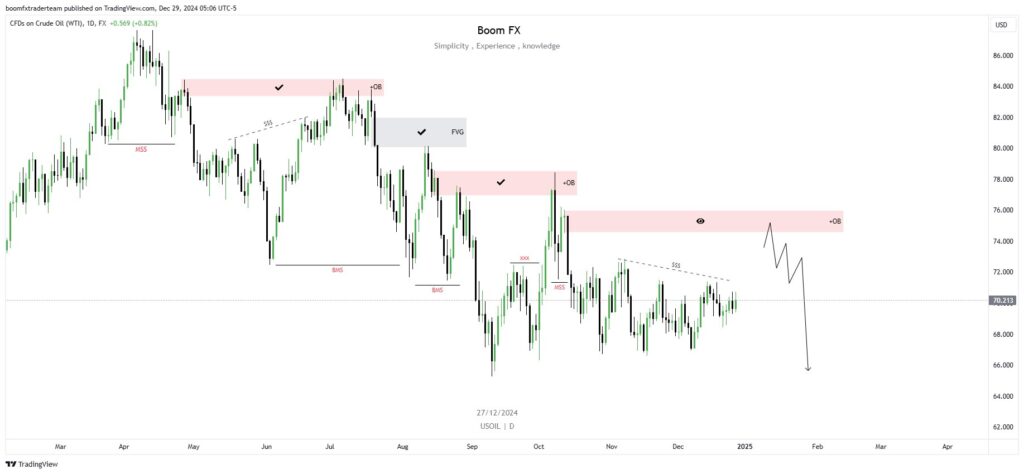
Overview: The daily chart for USOIL showcases a bearish trend structure with key levels identified for potential sell opportunities. Institutional concepts like Break of Structure (BMS), Order Blocks (OB), and liquidity points are central to the analysis. The projection anticipates a downward move after a retracement into supply zones.
Key Observations:
- Break of Market Structure (BMS):
- Multiple BMS levels confirm a bearish trend with lower highs and lower lows dominating the market.
- Each break strengthens the bearish sentiment, offering retracement-based entry opportunities.
- Mitigation Zones (OB):
- Red supply zones (Order Blocks) are highlighted, signaling institutional selling pressure.
- Price is likely to retrace into these zones before resuming its downward trajectory.
- Liquidity Sweeps (SSS):
- Liquidity grab zones are evident, where price clears stop-loss clusters before reversing.
- Fair Value Gap (FVG):
- A gray FVG is noted, representing inefficiencies that may attract price action for mitigation before a continuation.
- Projected Move:
- The projection suggests a bearish move, with price expected to reject the upper supply zone near 75.000 – 76.000 before targeting lower levels below 70.000
Trade Setup Idea:
- Entry:
- Look for short positions near the upper Order Block (OB) zone at 75.000 – 76.000 where significant selling pressure is anticipated.
- Confirmation:
- Use lower timeframe analysis to confirm bearish reversal patterns, such as bearish engulfing candles or break-of-structure entries.
- Take Profit (TP):
- The first target can be set near 68.000 , aligning with previous lows.
- Extended targets could aim for 65.000 or lower, depending on price momentum.
- Stop Loss (SL):
- Place stops just above the OB zone (77.000 – 78.000) to minimize risk in case of invalidation.
- Risk-to-Reward:
- Maintain at least a 1:3 risk-to-reward ratio for effective trade management.
Introductory Note for Post:
“Analyzing institutional footprints, USOIL presents a bearish outlook on the daily timeframe. Watch closely as price retraces into key supply zones before resuming its downward momentum. Precision is key – trade with the trend and secure optimal entries.”
Leave A Comment