
AUD/NZD Daily Analysis
AUD/NZD Daily Analysis
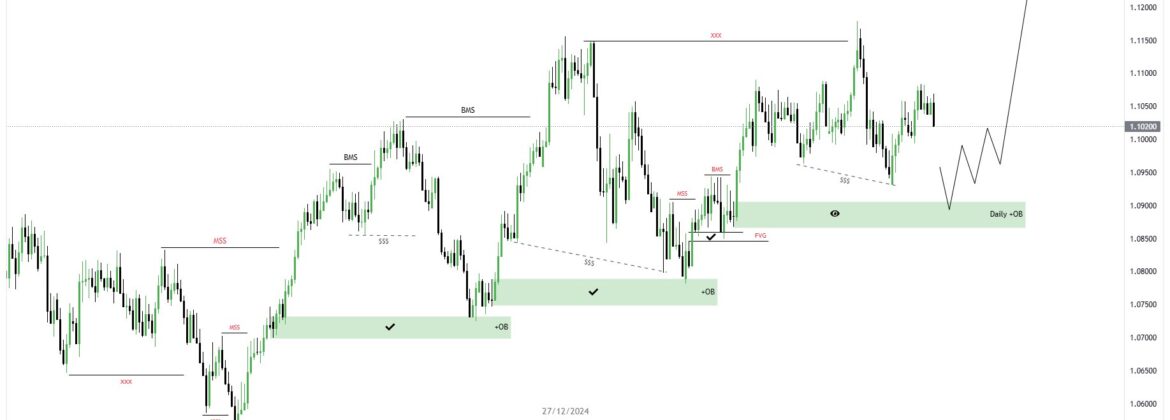
Overview: The daily chart for AUD/NZD highlights a clear structure of market behavior, with several key technical concepts like Break of Structure (BMS), Mitigation, and Fair Value Gaps (FVG). The focus appears to be on identifying potential reversal and continuation zones, aligning with a bullish outlook.
Key Observations:
- Break of Market Structure (BMS):
- Multiple BMS levels have been marked, indicating a shift in market sentiment from bearish to bullish.
- These breaks confirm higher highs, supporting the idea of potential trend continuation.
- Mitigation Zones (OB):
- Significant green zones (Order Blocks) are highlighted as areas of institutional interest, acting as potential support levels.
- Price is expected to interact with these zones before resuming its trend.
- Fair Value Gap (FVG):
- A small Fair Value Gap has been identified, representing inefficiencies in the market that price may revisit for mitigation.
- Liquidity Sweeps (SSS):
- Several liquidity levels are marked where the market has cleared stops, further validating institutional activity in these areas.
- Daily Bullish Order Block:
- A major zone at the lower end of the chart is labeled as “Daily OB,” serving as a critical support level for bullish setups.
- Projected Move:
- A bullish projection is shown, indicating potential price action to the upside after a retracement into the order block zone.
Trade Setup Idea:
- Entry:
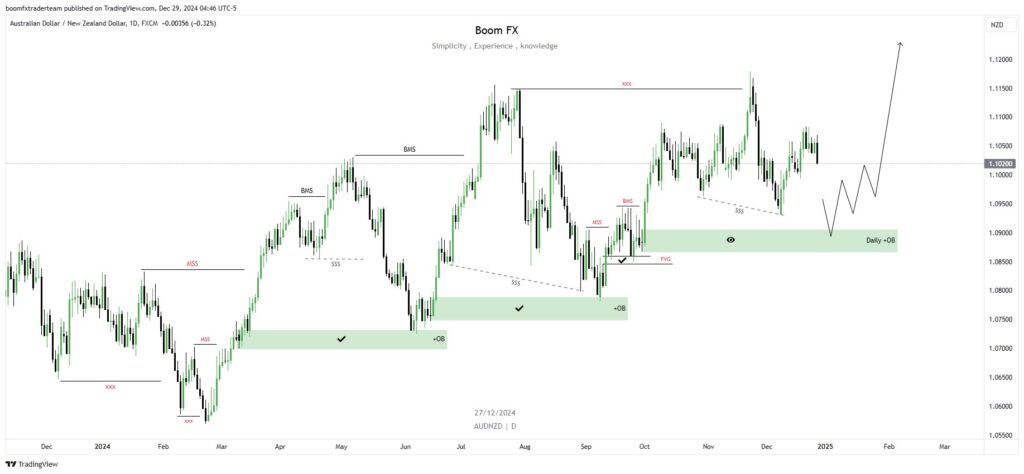
- Look for long opportunities around the highlighted Daily Order Block (OB) zone near 1.0900, where price is expected to retrace.
- Confirmation:
- Wait for bullish reversal patterns, such as bullish engulfing candles or lower timeframe structure breaks, before entering.
- Take Profit (TP):
- The first target can be set near 1.1050 (previous highs).
- Further targets could aim for 1.1200, aligning with the higher bullish projection.
- Stop Loss (SL):
- Place stops just below the Daily OB zone (around 1.0850) to minimize risk.
- Risk-to-Reward:
- Ensure a minimum 1:3 risk-to-reward ratio for optimal trade management.
Introductory Note for Post:
“Simplicity, experience, and knowledge combined – this AUD/NZD daily chart analysis breaks down institutional behavior for a clearer trading edge. Watch as price respects key zones and prepares for a bullish continuation. Trade with precision and confidence.”
Leave A Comment